
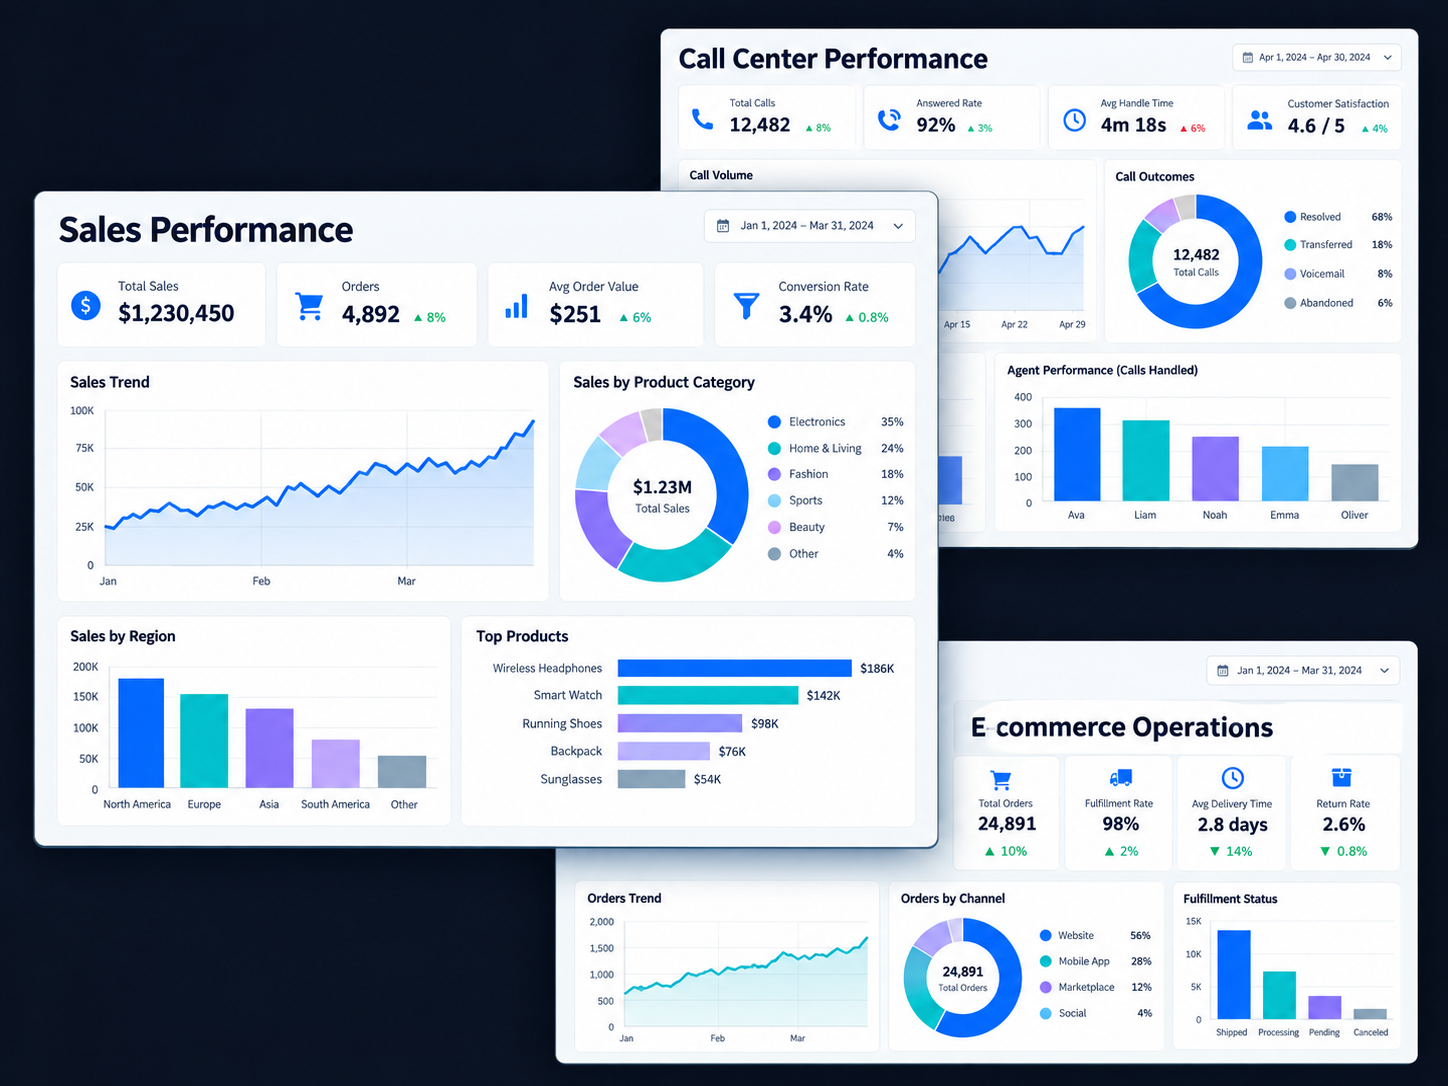
 Dashboard illustration
POWER BI PORTFOLIO
Business & operations dashboards
Explore my published seven-page portfolio, including call center and sales reporting.
Explore live reportDASHBOARD GALLERY
Published Power BI work and an interactive sales demonstration, with a downloadable Power BI project.
Showing 2 projects
Dashboard illustrationExplore my published seven-page portfolio, including call center and sales reporting.
Explore live reportFilter 2,304 synthetic orders by year and region to investigate revenue, profit, and category performance.
Try the sales demoLIVE DASHBOARD PREVIEW
Use the report’s page navigation to explore my profile, résumé, and dashboards.
Published Power BI report · Seven pages
EXPLORE THE DATA / 02
Change the filters to see how the story shifts.
Interactive web preview · Synthetic data · PHP
| Category | Revenue | Margin | Orders |
|---|